What statistics are there?
With ready2order you have the possibility to carry out a wide variety of evaluations in your statistics.
To access the statistics in the Admin Interface, click on the menu item Statistics or hover over it with the mouse and select one of the following statistics:
- product variations
- live statistics
- journal
- print assignments
- mail log
- workload
Statistics overview
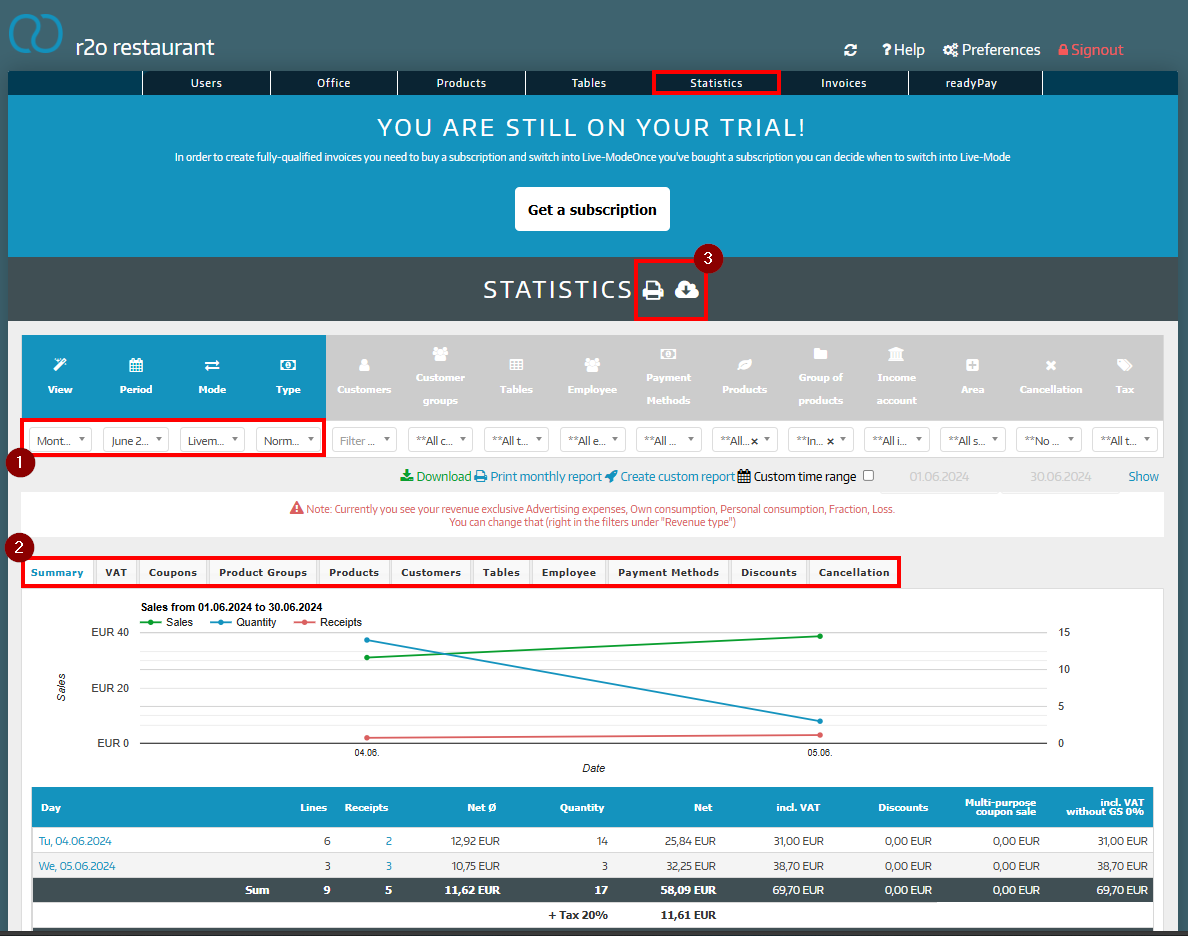
Click on Statistics and you will get the following overview.
- You can change the view, period, mode or sales type
- View: Choose between daily, monthly and annual and custom date range reports
- Period: For which month/week/day would you like to display the statistics?
- Mode: Live or test mode?
- Type: Total view, Normal turnover, Advertising expenses, Own consumption, Personal consumption, Fraction, Loss
- You can view a summary of your customers, customer groups, tables, employees, payment methods, products, groups of products, income account, area, cancellations, tax
Example: If you want to print out your sales sorted by products, click on Statistics, go to the Products tab, and click on the green download symbol above the pie chart. - Click on the printer symbol and print out the statistics. The cloud next to it with the arrow pointing down stands for export. Here you can export various statistics
For point 1: Restrict the view by clicking on "**All […]**" in the column you want and choosing one of the options. Filter units for which you perform this action will then be displayed with a blue background.
Under payment methods you will find evaluations of your card terminal (SumUp, ReadyPay)
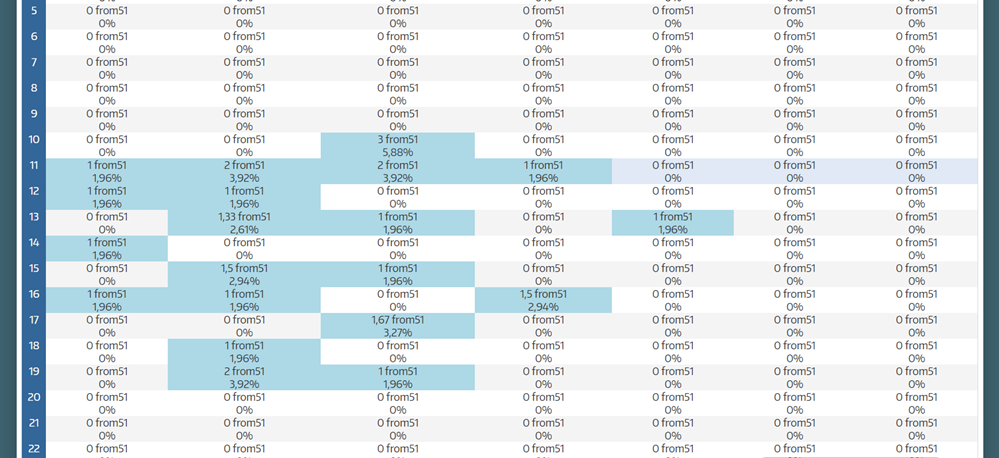
Workload
To access this feature, click on the Statistics workload tab.
Here you can see which area was busy at which hour and on which day.
You can display a daily, monthly or annual view .